- Cisco Community
- Technology and Support
- Wireless - Mobility
- Wireless
- 9800-40 IOS 17.9.4a web content not responding
- Subscribe to RSS Feed
- Mark Topic as New
- Mark Topic as Read
- Float this Topic for Current User
- Bookmark
- Subscribe
- Mute
- Printer Friendly Page
9800-40 IOS 17.9.4a web content not responding
- Mark as New
- Bookmark
- Subscribe
- Mute
- Subscribe to RSS Feed
- Permalink
- Report Inappropriate Content
11-15-2023 06:40 PM
Hi All,
i have performed a firmware upgrade from 17.6.4 to 17.9.4a.
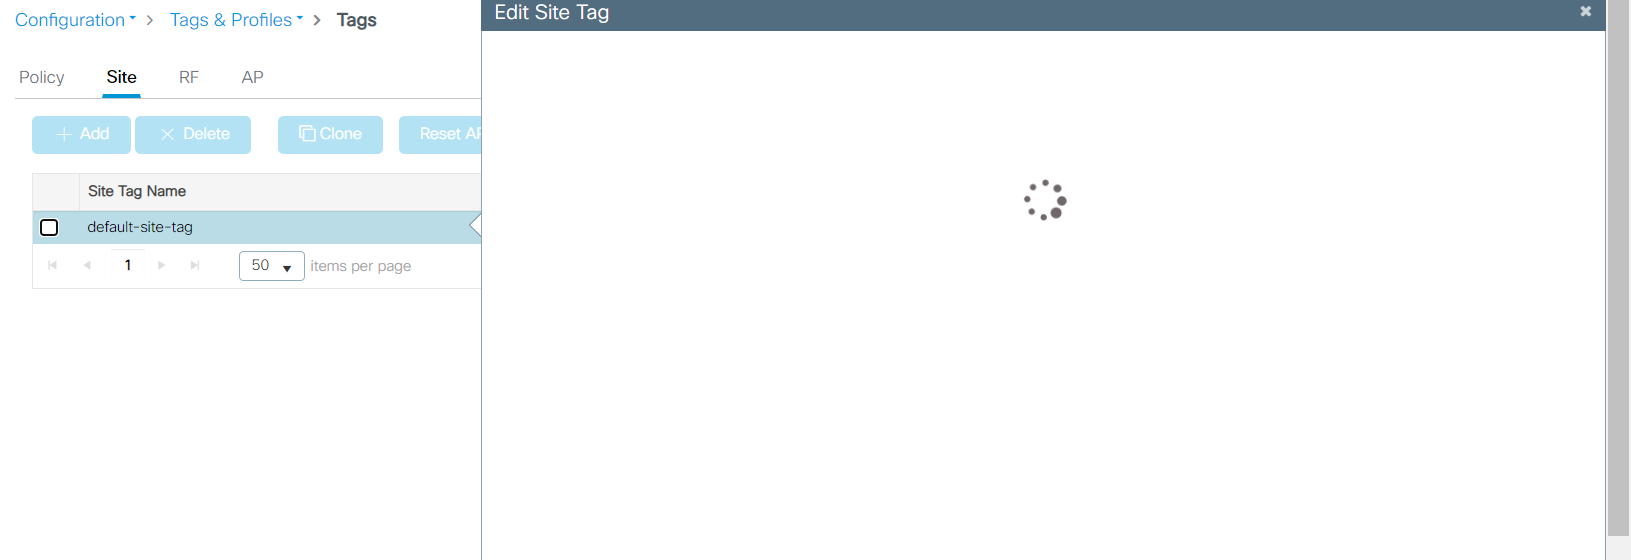
after the upgrade, the web is not responding well. it takes a long time to load or does not pop up the window that i click on.
Example:
edit a site tag, the loading icon is just spinning and does not pop the content
unable to view AP Statistics
Is there a bug in the the new version?
- Labels:
-
Wireless LAN Controller
- Mark as New
- Bookmark
- Subscribe
- Mute
- Subscribe to RSS Feed
- Permalink
- Report Inappropriate Content
11-15-2023 08:37 PM - edited 11-15-2023 08:47 PM
I have a pair of 9800-80 (HA SSO) on 17.9.4 with a memory leak (11 weeks uptime, 63% memory utilization) and the GUI is slow and does not render the information properly. Every time someone uses GUI, the WLC will spat out a dozen Tracebacks.
WLC#sh platform resources

**State Acronym: H - Healthy, W - Warning, C - Critical
Resource                 Usage                 Max             Warning         Critical        State
----------------------------------------------------------------------------------------------------
RP0 (ok, active)                                                                               H
 Control Processor       15.55%                100%            80%             90%             H
  DRAM                   39851MB(63%)          62892MB         88%             93%             H
  harddisk               0MB(0%)               0MB             80%             85%             H
ESP0(ok, active)                                                                               H
 QFP                                                                                           H
  TCAM                   90cells(0%)           1048576cells    65%             85%             H
  DRAM                   1578740KB(37%)        4194304KB       85%             95%             H
  IRAM                   14764KB(11%)          131072KB        85%             95%             H
CPU Utilization 5.00% 100% 90% 95% H - Mark as New
- Bookmark
- Subscribe
- Mute
- Subscribe to RSS Feed
- Permalink
- Report Inappropriate Content
11-15-2023 08:48 PM
i just tried to use the SP port for web access and it does not have the issue that was occurring on the VLAN interface.
Is there an additional setting for management?
- Mark as New
- Bookmark
- Subscribe
- Mute
- Subscribe to RSS Feed
- Permalink
- Report Inappropriate Content
11-15-2023 11:16 PM
- What do you mean ? Normally the SP port (address) should always be used for management access (CLI and GUI)
M.
-- ' 'Good body every evening' ' this sentence was once spotted on a logo at the entrance of a Weight Watchers Club !
- Mark as New
- Bookmark
- Subscribe
- Mute
- Subscribe to RSS Feed
- Permalink
- Report Inappropriate Content
11-16-2023 11:41 PM
The idea is to use the VLAN interface for management, due to the shortage of copper ports on our core switches.
we also set the management interface to VLAN.
It turns out the VLAN interface is not displaying the content as smoothly as the SP port does.
- Mark as New
- Bookmark
- Subscribe
- Mute
- Subscribe to RSS Feed
- Permalink
- Report Inappropriate Content
11-17-2023 12:29 AM
>... is not displaying the content as smoothly as the SP port does.
- It's a basic handicap to not use the SP for management as it is a basic purpose/requirement and should be used as such ,
M.
-- ' 'Good body every evening' ' this sentence was once spotted on a logo at the entrance of a Weight Watchers Club !
- Mark as New
- Bookmark
- Subscribe
- Mute
- Subscribe to RSS Feed
- Permalink
- Report Inappropriate Content
11-16-2023 05:48 AM - edited 11-16-2023 08:08 AM
Sounds like: https://bst.cloudapps.cisco.com/bugsearch/bug/CSCwe83994
Edit for more information:
To verify the bug above, in the CLI, use the command:
9800-Pair1#show processes cpu platform sorted | inc wnc
^^Note, that command does not include the d at the end (just wnc, not wncd). With the d is a commononly-used command to check the usage of each of the WNCD processes. While those are fine, it's the wncmgrd process that's high.
9800-Pair1#show processes cpu platform sorted | inc wnc
19462 19453 98% 98% 97% R 1448080 wncmgrd
19610 19602 31% 30% 32% S 999200 wncd_0
20185 20177 21% 18% 20% S 1109492 wncd_5
19725 19717 19% 21% 24% S 1097420 wncd_1
20301 20292 17% 18% 20% S 1100424 wncd_6
19840 19832 17% 17% 18% S 1050476 wncd_2
20070 20062 16% 18% 21% S 921784 wncd_4
20415 20407 1% 1% 1% S 928644 wncd_7
19955 19947 0% 15% 16% S 1032072 wncd_3
Also, if you browse the tracelogs directory, you may see dozens/hundreds/thousands of trace logs, for example:
9800-Pair1#dir harddisk:/tracelogs/
Directory of harddisk:/tracelogs/
1835891 -rw- 1274668 Nov 16 2023 10:59:51 -05:00 utf_R0-0.6606_3474562.20231116155949.bin.gz
1835890 -rw- 1325793 Nov 16 2023 10:59:49 -05:00 utf_R0-0.6606_3474561.20231116155946.bin.gz
1835874 -rw- 1243964 Nov 16 2023 10:59:46 -05:00 utf_R0-0.6606_3474560.20231116155944.bin.gz
1835873 -rw- 1260071 Nov 16 2023 10:59:44 -05:00 utf_R0-0.6606_3474559.20231116155942.bin.gz
1835865 -rw- 1258587 Nov 16 2023 10:59:43 -05:00 utf_R0-0.6606_3474558.20231116155941.bin.gz
1835862 -rw- 1285478 Nov 16 2023 10:59:41 -05:00 utf_R0-0.6606_3474557.20231116155939.bin.gz
1835857 -rw- 1285013 Nov 16 2023 10:59:39 -05:00 utf_R0-0.6606_3474556.20231116155937.bin.gz
This is what we found working on TAC case, SR 696136958, and the agent correlated the symptoms to that bug. If it matches what you're experiencing, if you haven't already, open a case citing the bug and my SR and request a fix for 17.9.x. It says 17.9.5 is affected, and that's not even out yet... I asked for an SMU, but that probably won't happen. Maybe something will happen if enough people complain. One can hope!
- Mark as New
- Bookmark
- Subscribe
- Mute
- Subscribe to RSS Feed
- Permalink
- Report Inappropriate Content
11-16-2023 01:23 PM
@eglinsky2012 wrote:
I asked for an SMU, but that probably won't happen.
At a minimum, engage your Cisco AM/SE/PSS in writing. That way there is evidence that someone made an attempt.
Usually, Cisco developers will only release SMU/APSP/APDP if a very big client (aka "a whale") demands it.
- Mark as New
- Bookmark
- Subscribe
- Mute
- Subscribe to RSS Feed
- Permalink
- Report Inappropriate Content
11-16-2023 11:51 PM
perform a factory reset and configure from scratch.
The performance is better. Will check again when see the laggy session again. Will open a ticket and check for other workarounds.


Discover and save your favorite ideas. Come back to expert answers, step-by-step guides, recent topics, and more.
New here? Get started with these tips. How to use Community New member guide
